I recently uploaded a video in my Youtube channel about Javascript debugging. In this blog post, I am sharing the important points from that video.
Using console
We all have used console.log for printing debug messages to the console. Along with log method, console also supports following methods:
- console.debug
- console.warn
- console.error
- console.info
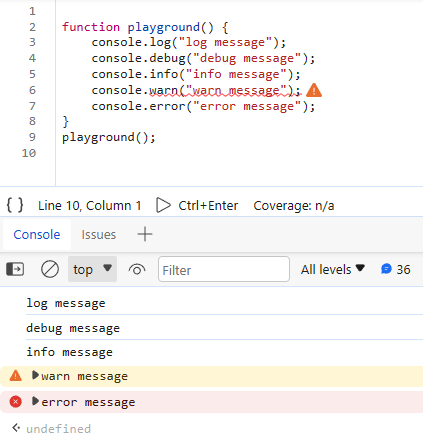
When you classify your debug messages using one of the above methods, you can easily spot them on the console (when there are ton of debug messages). Also, you can toggle to show only certain level of debug messages.
Using debugger
If you want to pause the program at some line, you can use debugger statement. At runtime, the browser will stop at the debugger line and will let you inspect the call stack and variable values at scope. You can modify a value directly from the console and resume the program execution. This will be really helpful when you quickly want to change a variable value and see how it effects the program flow.
Using breakpoints
The console.log and debugger tools are simple. But the drawback is that the source code needs to be modified. In most cases you do not want debugger messages ending up at production. So, it's better to separate break points from the underlying source code.
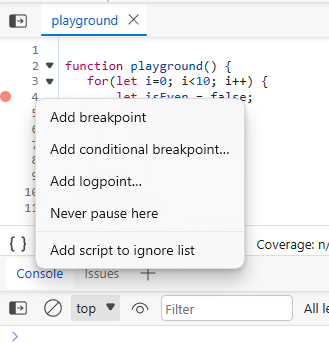
There are three types of breakpoints.
- breakpoint - stops the program execution whenever the control flow reaches it.
- conditional breakpoint - stops the program execution only when a certain conditions, defined by you, are true.
- logpoint - does not stop the program execution, but prints out the message given by you when control flow reaches.
Using exception handling
For the case when you need to debug when some part of your code throws an error, make use of "Pause on uncaught exceptions" setting under Breakpoints section. Checking this option will tell the browser to pause at the code that throws an error object that isn't handled anywhere in the code.
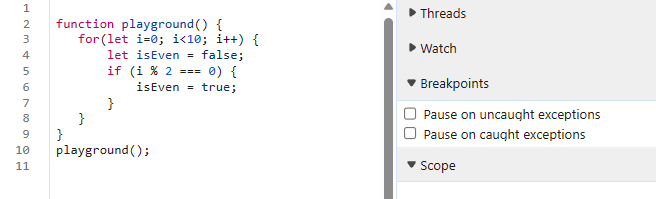
If the error is handled somewhere, but you still want to pause the program execution when the error is thrown, check the option "Pause on caught exceptions".
Using DOM and XHR breakpoints
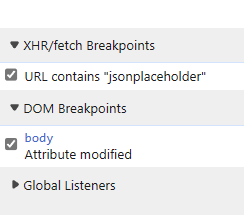
When a DOM element is modified, and you want to know which code mutates the DOM element, you can enable a breakpoint that pauses just before the mutation happens and places the focus on the code line that initiated the mutation. This is really helpful when a third party library modifies the DOM and you need to which code does it. You can break on
- subtree modifications - where the child nodes are modified
- attribute modifications - where the attributes such as classname, id is changed
- node removal
Just right-click on the DOM element in the Elements panel and you will see the option "Break on" to set these breakpoints.
Similarly, you can add a XHR breakpoints that will pause the program execution when a network request is made to the given URL.
Conclusion
These are some of my goto tools and techniques for JavaScript debugging. What are your tips? Feel free to share in comments.